Why HiPo Programs Should Measure More Than Tenure: Years of Experience Predicts Two Psychometric Traits
Filed under: Psychometrics · Talent Development
Years of professional experience is the most common high-potential filter in enterprise talent programs and the most common gate on L&D budget allocation. The implicit assumption behind tenure-based filters is that more years of work proxy for some bundle of leadership-relevant traits, and that filtering on tenure raises the average of those traits in the candidate pool.
Two custom psychometric studies, one for a Fortune 1000 enterprise IT services firm and one for a fast-growing consumer-tech company, ran structural equation models on their respective samples to test how years of experience related to the traits each instrument measured. Both models converged on the same structural finding. Years of experience predicted exactly two traits in each study. The other traits each instrument measured did not move with tenure at all.
That is a finding I would not have predicted from theory alone. It is also the kind of finding that sharpens what tenure-based filtering is actually doing in a high-potential program, and what it is not doing.
This post is the second in a three-part series sourced from the two engagements. Part 1 covered the four-archetype convergence in the cluster analyses from the same data. Part 3 covers the build-versus-buy decision for psychometric instruments. The methodology context for all three lives in the earlier post on what custom psychometric work actually is.
Table of Contents
- Why the SEM analysis matters here
- Organization A: experience predicts curiosity and self-efficacy
- Organization B: experience predicts growth mindset and ownership
- The cross-model convergence
- What this changes about high-potential program design
- Honest caveats and what comes next
Why the SEM analysis matters here
Structural equation modeling lets you test relationships between variables in a way that simpler correlation analysis does not. Years of experience as the exogenous variable, the measured traits as the endogenous outcomes, with residual covariances allowed among the traits to account for the fact that they are correlated with each other. The output is a set of standardized regression coefficients (the betas) showing how much each trait moves per standard deviation of experience, with significance tests on each path.
The reason both engagements ran SEM rather than simple correlations is that simple correlations between experience and any one trait can be inflated or attenuated by the correlations between traits. Curiosity and Self-Efficacy correlate with each other. Self-Discipline correlates with Directness. A correlation between experience and Curiosity, in isolation, is partly picking up the experience-Self-Efficacy relationship through the Curiosity-Self-Efficacy correlation. The SEM controls for this by modelling the trait covariances directly.
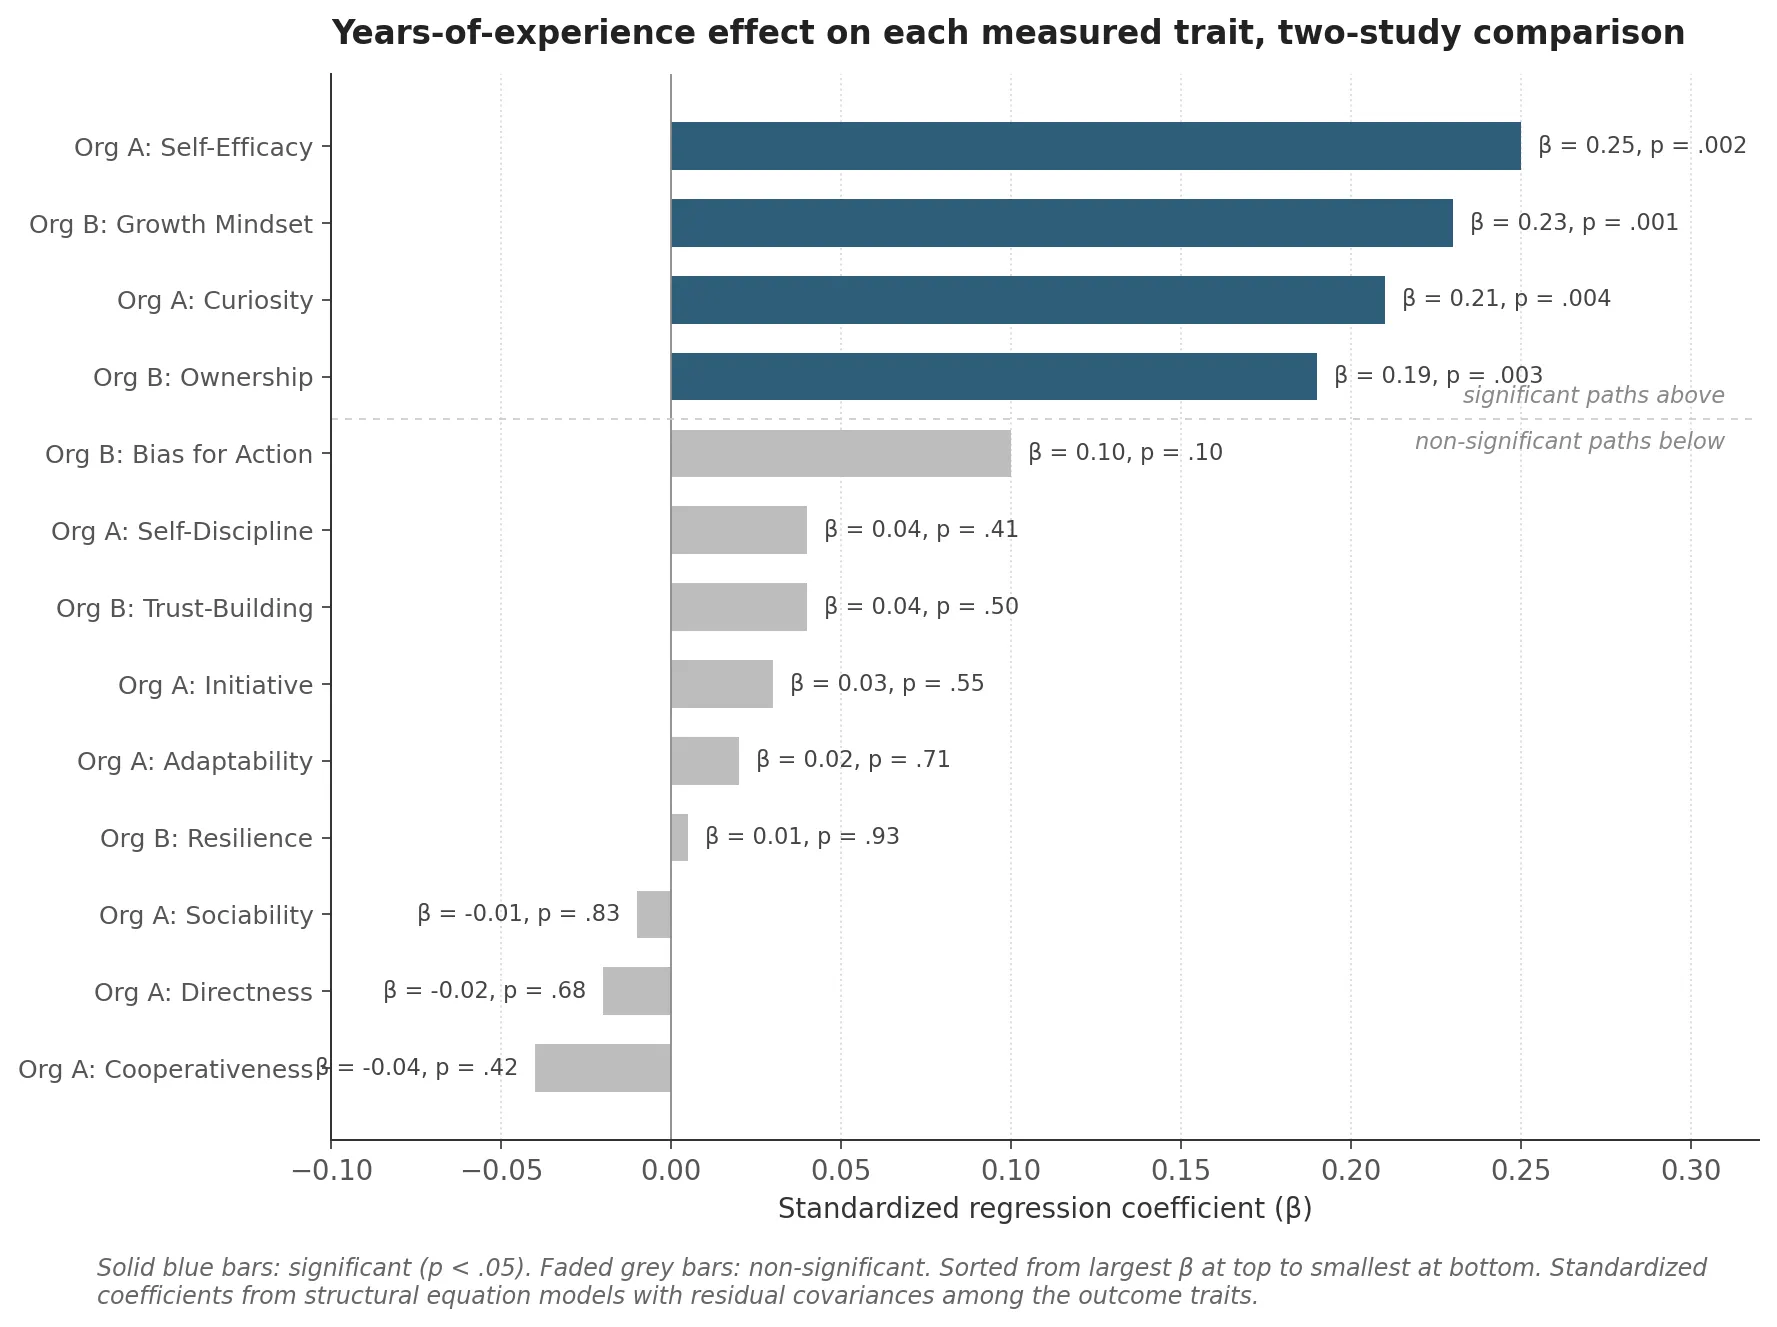
The interpretive question becomes: which traits show a non-zero relationship with experience after the trait covariances are accounted for? In both studies the answer was two traits, and in both studies those two traits were a curiosity-family trait and a self-efficacy or ownership-family trait. The other traits the instruments measured produced near-zero standardized coefficients, with p-values nowhere near significance.
Organization A: experience predicts curiosity and self-efficacy
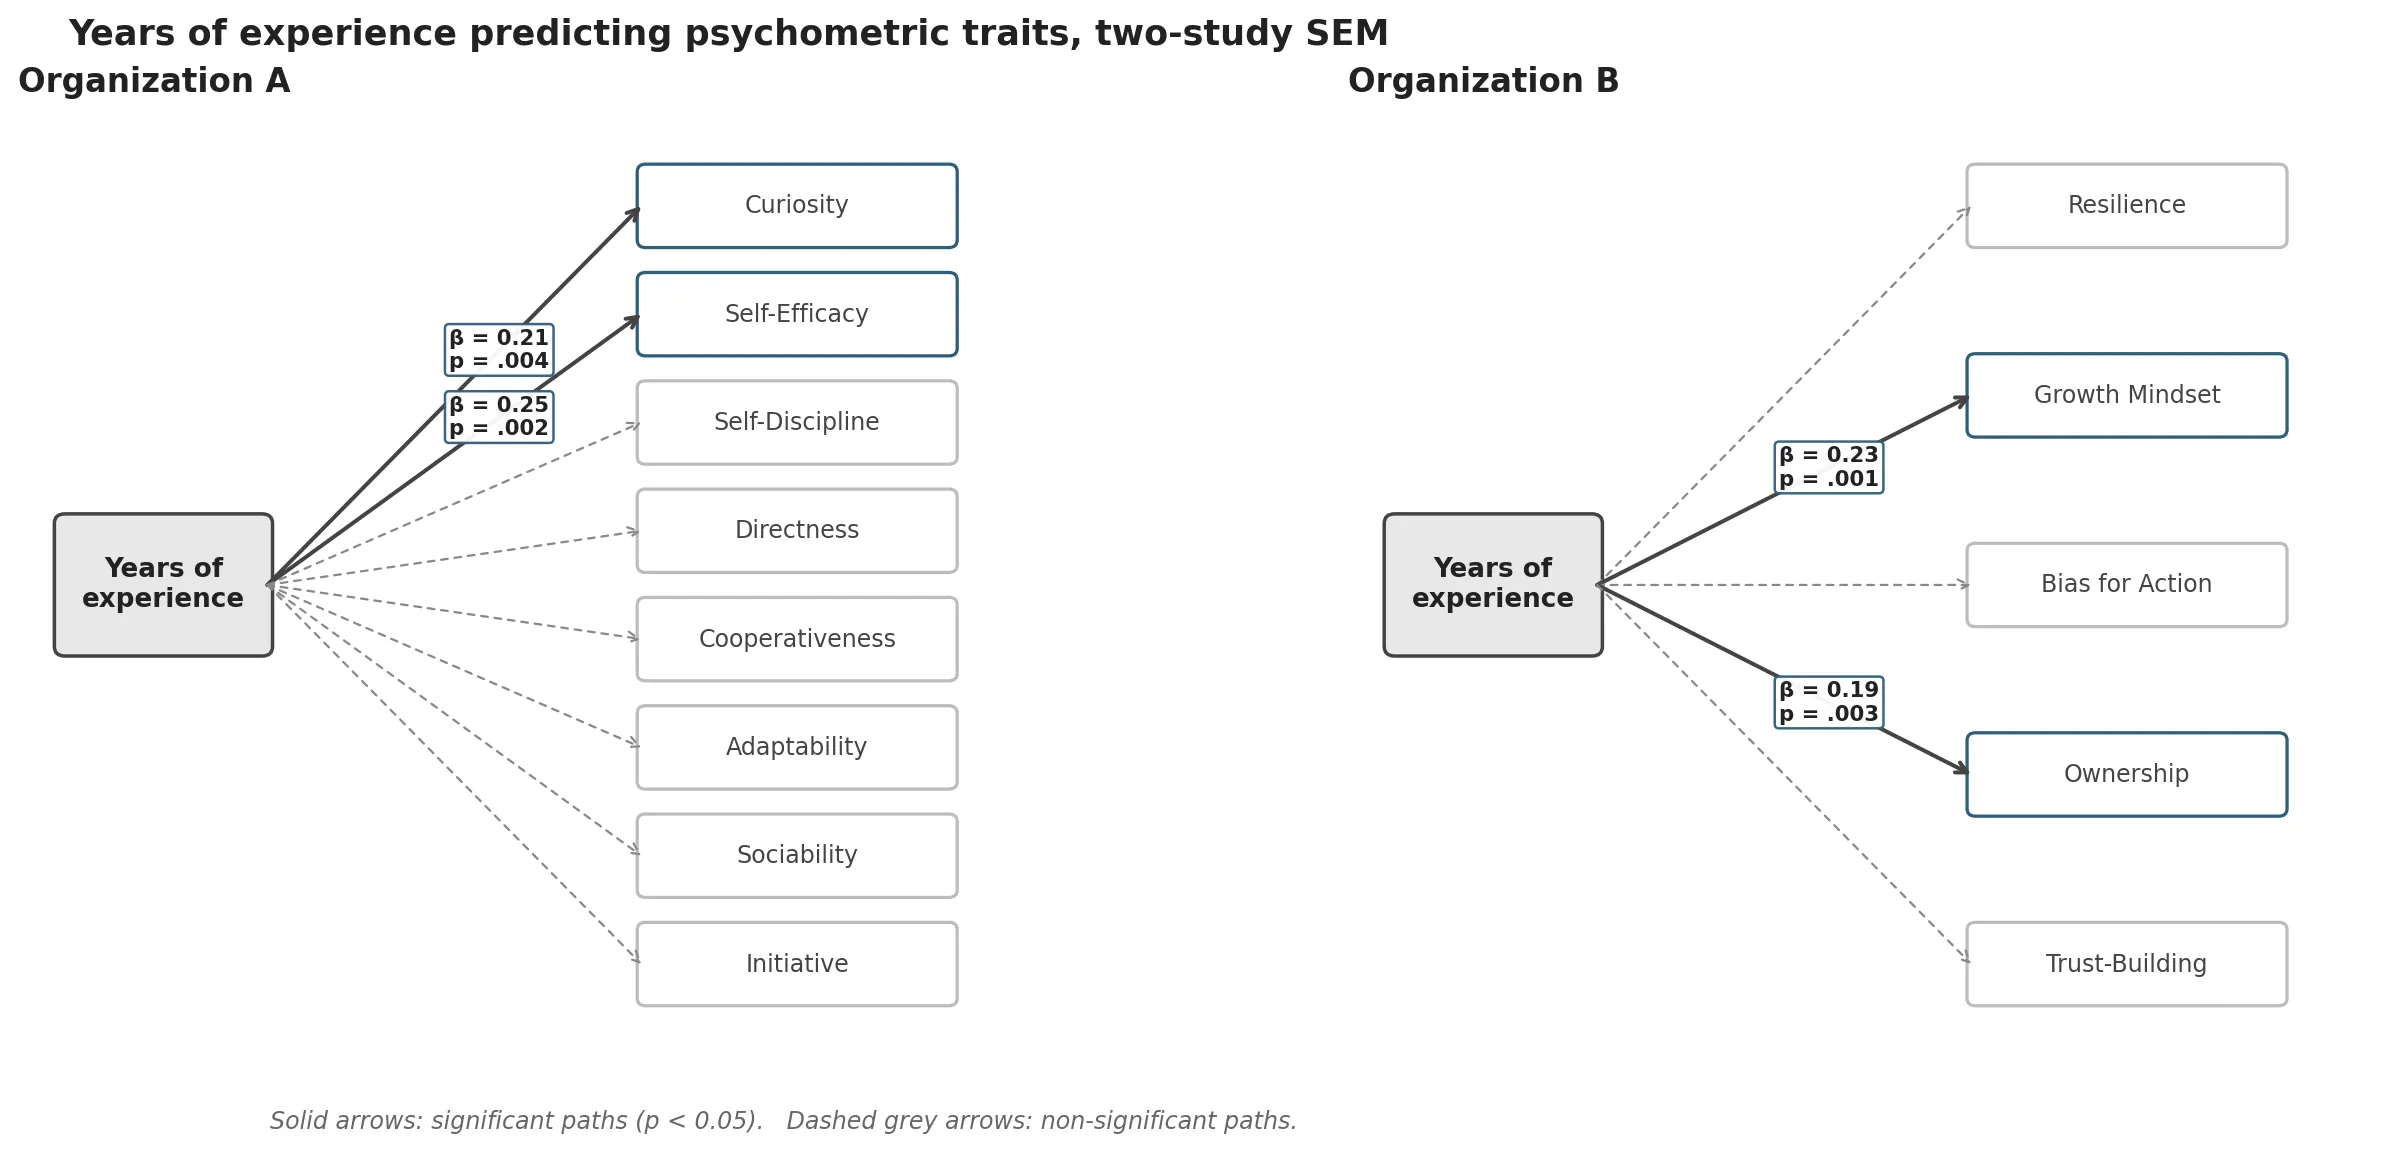
Organization A used a Big Five-derived strengths model assessing eight competencies. The SEM tested how years of professional experience related to each competency. Two paths reached statistical significance:
- Curiosity: standardized β = 0.21, p = 0.004
- Self-Efficacy: standardized β = 0.25, p = 0.002
Other paths in the model (Self-Discipline, Directness, Cooperativeness, Adaptability, Sociability, Initiative) showed coefficients close to zero with p-values well above the conventional 0.05 threshold. Tenure was uncorrelated with these traits in any meaningful way.
The interpretive frame for the two significant paths:
Curiosity in the working sense is intellectual openness, a tendency to ask “why” before “how”, a willingness to engage novel problems. The theoretical case for why exposure should build curiosity is straightforward. Repeated successful engagement with novel problems reinforces the disposition. The more a professional encounters genuinely new territory in their work, and the more often that encounter ends with insight rather than failure, the more the curiosity disposition gets reinforced as a stable orientation. β = 0.21 is consistent with this account: tenure is part of what builds curiosity, but only part. Other variables (role design, manager quality, intellectual environment) explain more of the variance.
Self-Efficacy as a working construct is confidence in one’s own capability to deliver. Albert Bandura’s classic finding from the 1970s onward is that self-efficacy is built primarily through what he called mastery experiences, the repeated experience of attempting something difficult and succeeding. More years of work means more chances to accumulate mastery experiences, which means more self-efficacy on average across a population. The β = 0.25 path is exactly what the Bandura account predicts.
Neither effect is large. β = 0.21 means a one-standard-deviation increase in experience corresponds to a 0.21-standard-deviation increase in Curiosity, holding the other trait covariances constant. That is a real but modest relationship. The point is not that experience is a strong predictor of these two traits; the point is that experience is a specific predictor.
Organization B: experience predicts growth mindset and ownership
Organization B used a custom five-value instrument designed against the company’s own operating language. The five values, in their construct-translated names, are Resilience, Growth Mindset, Bias for Action, Ownership, and Trust-Building. The construct labels are accurate translations of what each value measures. The brand-specific labels in the original instrument are different.
The SEM tested how years of experience related to each of the five values. Two paths reached statistical significance:
- Growth Mindset: standardized β = 0.23, p < 0.001
- Ownership: standardized β = 0.19, p = 0.003
The other three values (Resilience, Bias for Action, Trust-Building) showed near-zero standardized coefficients with non-significant p-values. As with Organization A, tenure was uncorrelated with these traits in any meaningful way.
The interpretive frame for the two significant paths:
Growth Mindset in the working sense, drawing on Carol Dweck’s framework as it applies to professional contexts, is an orientation toward learning, a willingness to engage challenges as opportunities for development rather than threats to self-image. Like Curiosity in Organization A’s model, this is a disposition that exposure can reinforce, but only when the exposure includes feedback that frames challenges as growth opportunities rather than tests of fixed ability. The fact that growth mindset correlated with experience in this sample suggests the population’s average professional environment provided that kind of feedback. β = 0.23 is consistent with the developmental account.
Ownership is the behavioral cousin of self-efficacy. Willingness to take responsibility for outcomes, see-it-through commitment, the disposition that stops a professional from passing problems to someone else. It builds with mastery experiences in the same way self-efficacy does, and it builds in environments that reward initiative rather than penalize ownership of mistakes. β = 0.19 is the smallest of the four significant paths across the two studies, but still well above the noise threshold.
Notice the structural pairing across the two studies. Each model produced one curiosity-family trait that grew with experience (Curiosity in Organization A, Growth Mindset in Organization B) and one self-efficacy-family trait that grew with experience (Self-Efficacy in Organization A, Ownership in Organization B). That pairing is the cross-model convergence.
The cross-model convergence
Two completely different instruments, different theoretical scaffolding, different populations, both pulled the same two-trait pair out as the experience-sensitive subset.
| Construct family | Organization A | Organization B |
|---|---|---|
| Curiosity, openness to novelty, growth orientation | Curiosity (β = 0.21) | Growth Mindset (β = 0.23) |
| Self-efficacy, capability confidence, ownership | Self-Efficacy (β = 0.25) | Ownership (β = 0.19) |
| Other measured traits | Self-Discipline, Directness, Cooperativeness, Adaptability, Sociability, Initiative (all non-significant) | Resilience, Bias for Action, Trust-Building (all non-significant) |
The interpretation: there is a class of psychometric traits that develops through professional exposure (curiosity, growth orientation, self-efficacy, ownership), and a class that does not (resilience, trust-building, discipline, cooperativeness, directness). The first class is partly a function of how long someone has been working. The second class is dispositional, established earlier than tenure-relevant time horizons can capture, or shaped by factors other than work exposure.
This is a stronger finding than either study would support on its own. One study showing two specific traits responding to experience could be an artifact of the instrument or the sample. Two studies, on different instruments and different populations, converging on the same construct families is a different kind of evidence. It is consistent with a general claim about the developmental psychology of professional work, and the claim has theoretical backing from Bandura on self-efficacy and Dweck on growth mindset, both of whom describe traits that develop through structured exposure.
The strong version of the claim, that this two-construct-family pattern would replicate across many populations and instruments, is not something I can defend from two studies. It is a hypothesis worth testing in further work. The weak version, that tenure is a specific rather than a general predictor of psychometric traits in working populations, is well-supported by the data here.
What this changes about high-potential program design
Most enterprise high-potential programs use tenure as a primary qualifying filter. “Five or more years of experience” or “eight or more years” is the threshold for many leadership pipeline programs. The implicit assumption is that tenure proxies for the bundle of leadership-relevant traits the program is designed to develop further.
What these two SEM models say: tenure does proxy for some of those traits. Filtering on tenure correctly raises the average of curiosity and self-efficacy or ownership in the candidate pool. If the program is designed around developing growth mindset and ownership further, tenure-based filtering is doing useful work at the front of the funnel.
What tenure does not proxy for: resilience, trust-building, discipline, cooperativeness, directness, adaptability. A candidate pool filtered to “eight or more years” looks identical to a candidate pool filtered to “three or more years” on these traits. The candidates with high resilience and high trust-building are distributed across tenure ranges roughly evenly, which means the longer-tenure pool does not over-represent them.
The operational consequence is direct. A high-potential program that relies on tenure as its dominant filter is well-calibrated for half its target competencies and blind on the other half. If the program is meant to surface candidates with strong resilience and trust-building, alongside curiosity and ownership, tenure will not help with the resilience and trust-building dimensions. The program needs measurement of those traits alongside tenure, not as a replacement for it but as a complement.
The same logic applies to L&D investment. If an L&D program targets growth mindset development, exposure-based mechanisms (rotations, stretch projects, novel problems) are theoretically defensible. That is what the data says builds growth mindset. If an L&D program targets resilience development, exposure alone is insufficient. Resilience is not responsive to tenure in either dataset, which means the development design needs different mechanisms: structured stress exposure, coaching, deliberate cognitive frameworks like Dweck-style or Petrie-style interventions. The tenure-equals-development implicit model is wrong for this dimension.
The cluster-by-role table from Part 1 compounds with this finding. A role category dominated by Confident Specialists (independent, high self-efficacy, lower cooperativeness) is staffed with people whose self-efficacy already scores high. Adding more tenure to that pool will not dramatically improve self-efficacy further, because the ceiling is already close. The development opportunity for that pool is in the dimensions tenure does not move: cooperativeness, adaptability, trust-building. The cluster table tells you which dimensions need targeted work for which role mix; the SEM tells you which dimensions tenure will not solve on its own.
Honest caveats and what comes next
The β coefficients in this analysis fall in the 0.19 to 0.25 range. These are real but modest effects. Tenure explains a small fraction of the variance in the two construct families, and most of the variance in those traits is explained by other factors I cannot disentangle from these models alone. The takeaway is the specificity of the effect (these two construct families and not the others), not the strength (which is small).
Two studies in two adjacent industries do not constitute a generalizable finding. The pattern is suggestive enough to act on with humility, not strong enough to claim as a universal rule. Replication across more populations, more instruments, and especially more diverse industries would be needed to defend a strong general claim.
The instrument-specific interpretations involve construct-mapping judgment. Calling Organization A’s Curiosity a member of the same construct family as Organization B’s Growth Mindset is a defensible read but not the only possible read. A different psychometrician working from the same data might map the constructs differently. The four-bar visual story in the coefficient chart would still hold, but the interpretive labels would differ.
These are correlational findings within a cross-sectional sample. Without longitudinal data on the same individuals over time, the “experience builds these traits” reading has alternative explanations. Selection effects are the obvious one: the people who develop curiosity through early career may stay in their professions longer than people who do not, which means they show up in higher-tenure samples at higher rates than less-curious peers. The cross-sectional data cannot distinguish between “experience builds curiosity” and “curiosity-developers stay long enough to be measured at higher tenures”. The truth is probably some mix of both.
Part 3 of this series turns to the build-versus-buy question for psychometric instruments. Organization A used an off-the-shelf Big Five-derived assessment. Organization B used a custom five-value instrument. Both produced usable findings. The decision rule for which approach is right for which case is not what most buyers think it is, and the two studies in this series are useful worked examples for that decision.
If you are designing a high-potential program at your own organization and want to talk about how psychometric measurement fits alongside tenure and performance data, I am reachable through the contact form. The methodology context for all of this lives in the earlier post on what custom psychometric work actually is, and more on the platform side of this work lives at Gyfted.