Four Workplace Personality Types Recovered Across Two Custom Psychometric Studies
Filed under: Psychometrics · Talent Development
Two enterprise clients commissioned custom psychometric work in the same eighteen-month window. Different instruments, different industries, different countries. One organization is a Fortune 1000 employer with several thousand professionals in scope. The other is a fast-growing consumer-tech company with a global candidate pipeline. The first study used a Big Five-derived strengths model. The second used a custom five-value instrument designed against the company’s own operating language. Roughly 500 employees in the first sample. Roughly 330 candidates in the second.
Different theoretical scaffolding, different populations, different decisions. Both studies produced four-cluster solutions. The four clusters meant structurally similar things across both studies. That convergence is not a finding I can attribute to either instrument.
This post is the first in a three-part series sourced from the two engagements. Part 2 covers what years of professional experience does and does not predict in psychometric scores. Part 3 covers when off-the-shelf personality assessment is the right call and when a custom instrument earns its longer build cycle. The methodology context for all three lives in an earlier post on what custom psychometric work actually is.
Table of Contents
- The convergence finding
- Organization A: four archetypes from a Big Five-derived assessment
- Organization B: four archetypes from a custom-values instrument
- The cross-mapping
- The most-used artifact in both decks
- The L&D budget allocation model the table enables
- Honest caveats and what comes next
The convergence finding
Cluster analysis is a descriptive method. You feed it a sample of people scored on a set of traits, you specify how many clusters you want, and it groups people into those clusters by minimizing within-group variance. The output is sample-specific. Run the same method on a different sample with a different instrument and you should expect a different cluster structure, because the input space is different.
Both client studies ran four-cluster solutions on their respective trait sets. The four-cluster choice was driven by silhouette and elbow diagnostics in each case, with stability checks across resamples. The clusters that emerged were not identical across the two studies. The instruments were too different for that. What was identical was the shape of the four-cluster space: one cluster that maps to disciplined goal-driven execution, one to independent technical strength, one to curious flexible growth orientation, and one to lower baseline scores typical of early-career or developmental cases.
That structural parallel across instruments is the finding I want to unpack. It would be easy to read it as a quirk of two adjacent samples, and that reading might be right. It is also possible the four-archetype structure reflects how professional traits actually distribute in working populations, in which case the implication for talent strategy is real.
Organization A: four archetypes from a Big Five-derived assessment
Organization A is a Fortune 1000 enterprise IT services firm. The engagement covered roughly 500 professionals across people functions, engineering and technology, leadership and executive roles, and talent and recruiting. The instrument was a Big Five-derived strengths model assessing eight competencies: Self-Discipline, Directness, Cooperativeness, Curiosity, Self-Efficacy, Adaptability, Sociability, and Initiative. All eight are standard facets in the broader Big Five literature, scored from 0 to 100 against the population norm.
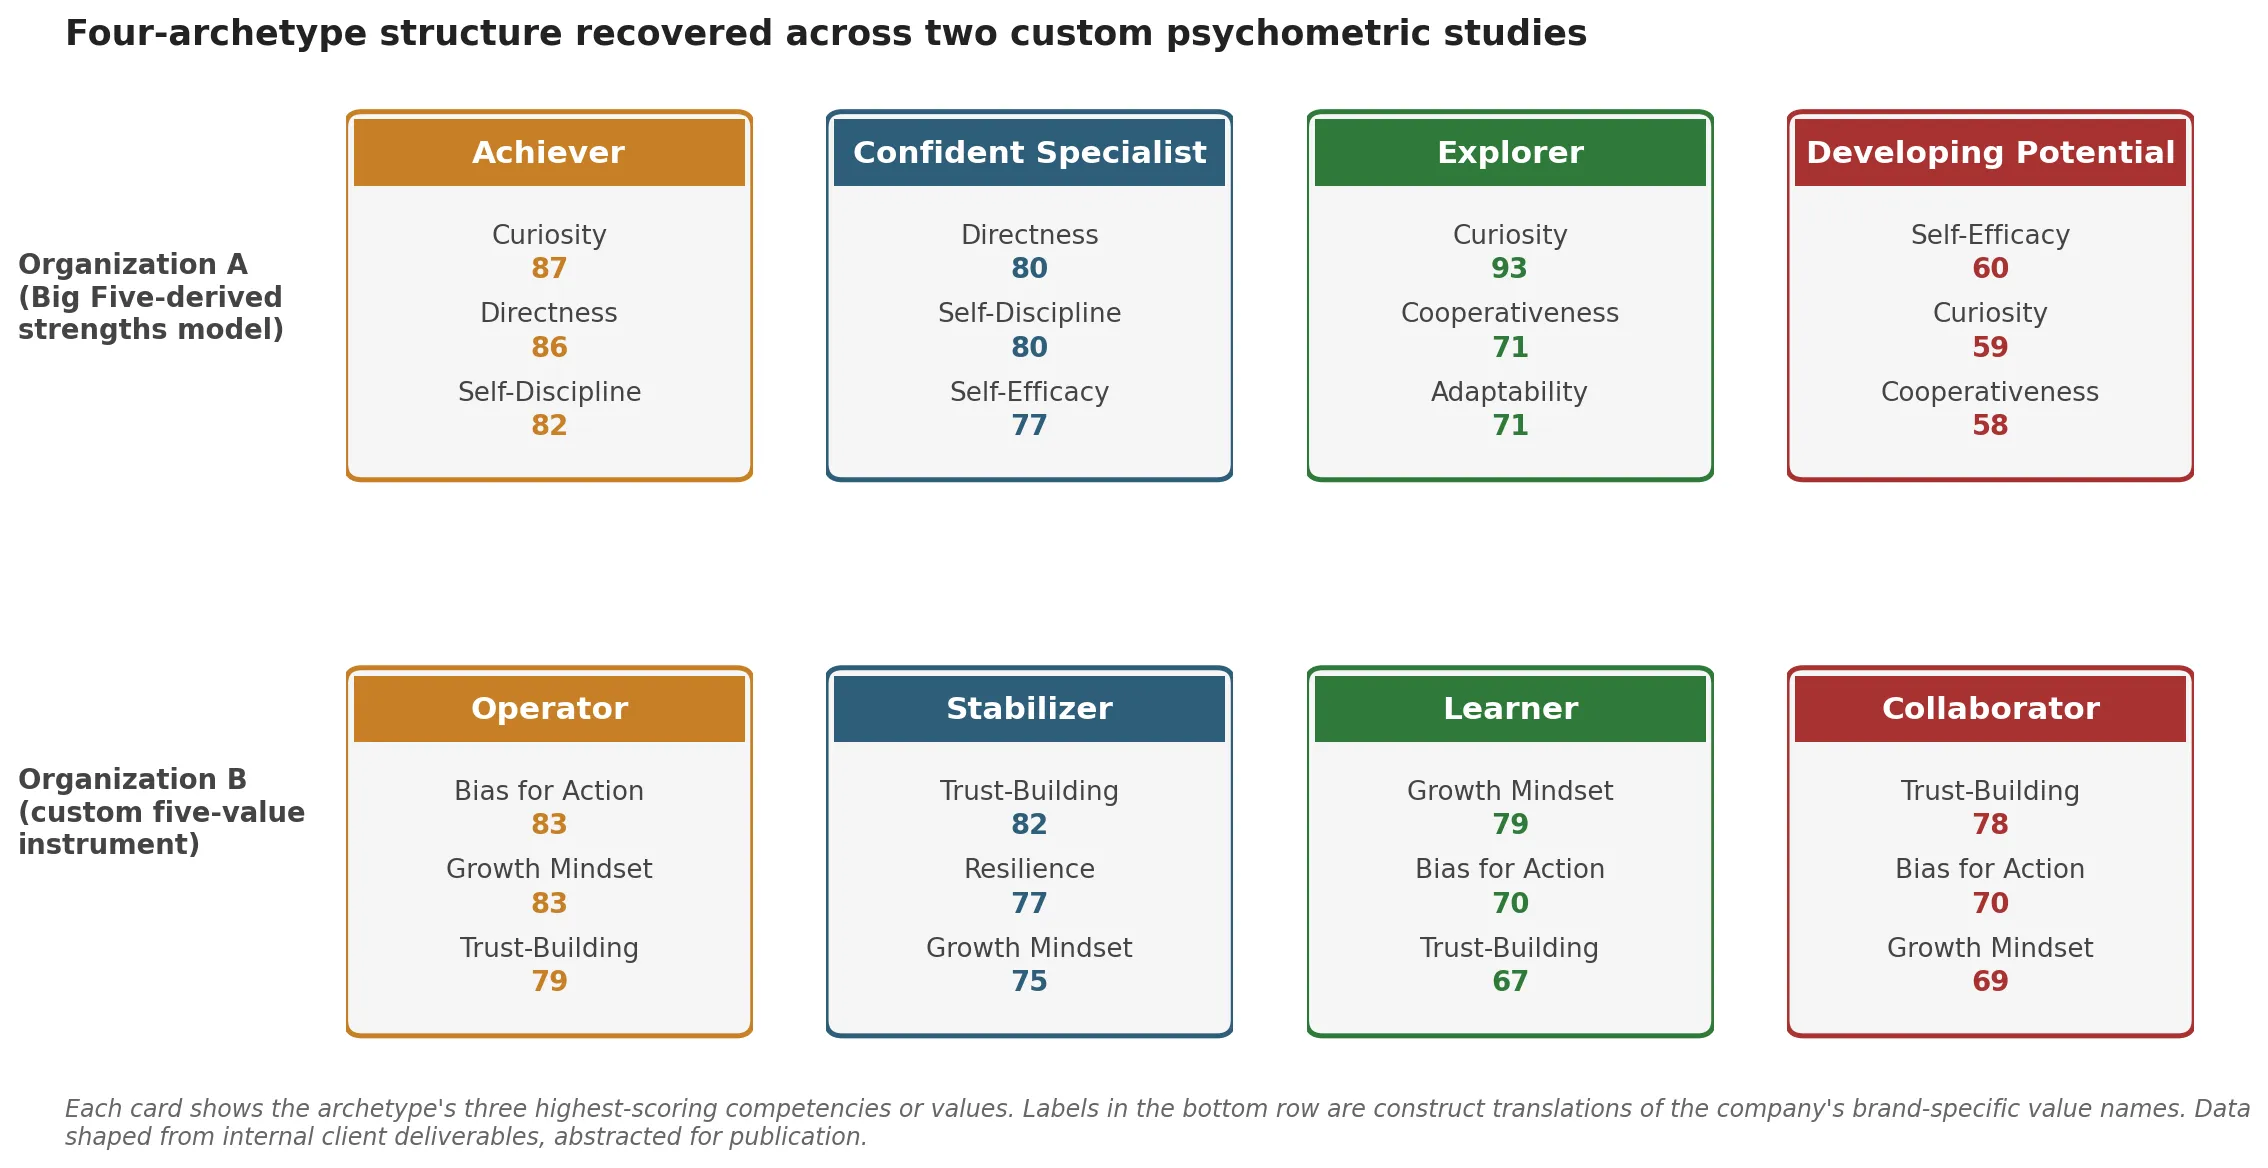
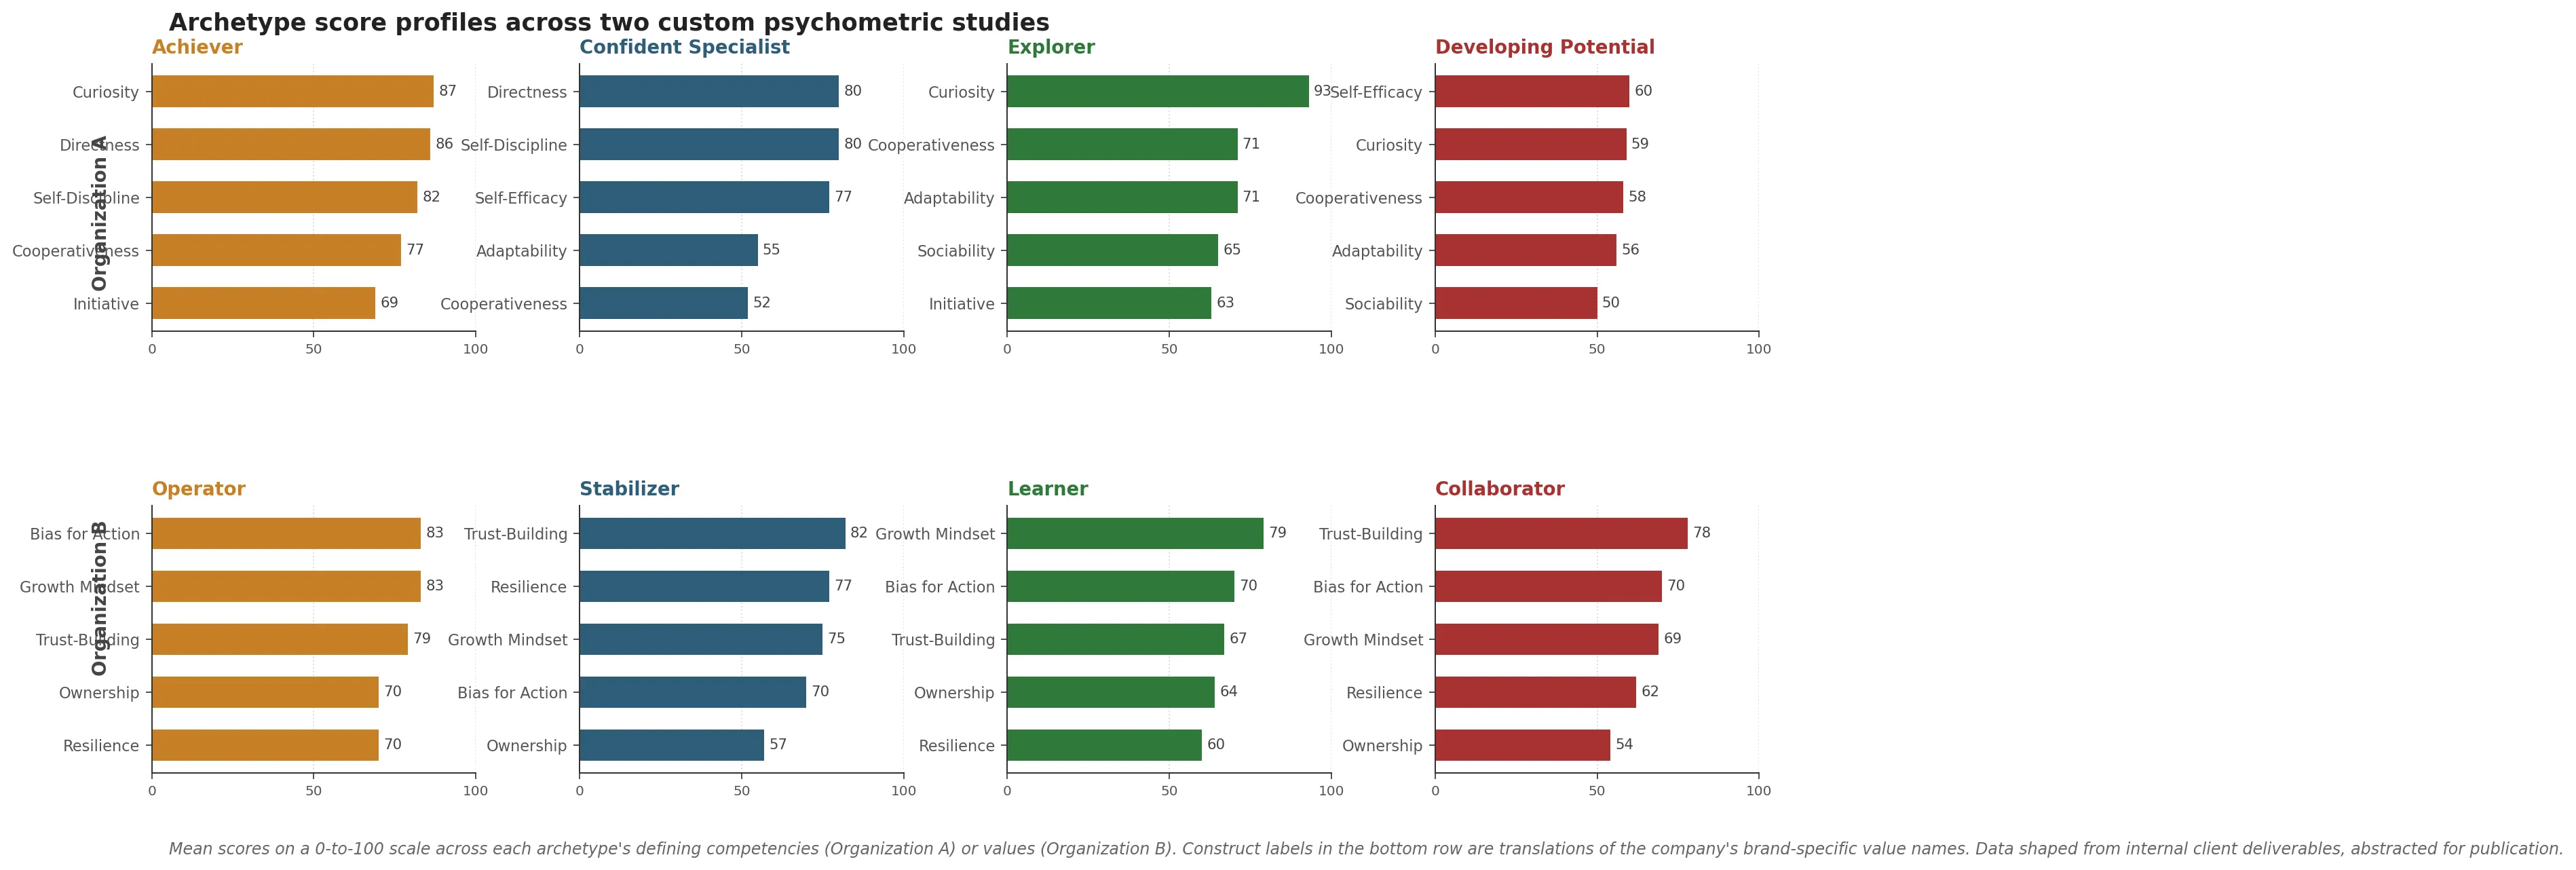
Four clusters emerged, with the following profiles:
Achiever. Highest in Self-Discipline (around 82), Directness (around 86), and Cooperativeness (around 77). Strong in Curiosity (around 87) and Initiative (around 69). Goal-driven, disciplined, decisive. The profile fits people who thrive in structured execution roles. Strong fit for people and HR functions, talent acquisition, and delivery leadership where execution and ownership matter.
Confident Specialist. Highest in Self-Efficacy (around 77), Self-Discipline (around 80), and Directness (around 80). Lower in Adaptability and Cooperativeness. Independent, skilled, confident in their own capability. The profile suits individual-contributor or technical-expert roles where solo work and depth matter more than collaboration breadth. Often found in engineering, specialized consulting, and senior technical advisory.
Explorer. Highest in Curiosity (around 93), Adaptability (around 71), and Cooperativeness (around 71). Balanced on most other competencies. Curious, flexible, collaborative. Strong fit for innovation-driven projects, cross-functional teams, and early leadership roles where the work involves ambiguity and iteration. Common in program and delivery, engineering, and product development.
Developing Potential. Lower across most competencies, especially Curiosity (around 59) and Sociability (around 50). Likely early-career or in need of structured development support. The profile is not a verdict, it is a starting point. These people benefit most from mentorship, structured onboarding, and role clarity.
The round numbers above are approximate. The substantive ranking, which competency is highest and which is lowest in each cluster, is what carries the interpretive weight. A four-cluster solution on this instrument and this population produced these archetype shapes consistently across resamples.
Organization B: four archetypes from a custom-values instrument
Organization B is a fast-growing consumer-tech company with a global candidate pipeline. The engagement covered roughly 330 candidates, with about 76 percent completing the full assessment. The instrument was a custom five-value model designed against the company’s own operating language, with the five values mapped to standard psychometric constructs as follows: Resilience, Growth Mindset, Bias for Action, Ownership, and Trust-Building. The construct labels are translations of the company’s brand-specific value names. The translations are accurate to what each value measures; they are not euphemisms.
Why a custom instrument rather than off-the-shelf personality assessment is a question I will treat in detail in Part 3 of this series. The short version: the company’s operating language and values architecture did not map cleanly onto Big Five facets, and using off-the-shelf personality measurement would have introduced a construct-language gap between the instrument and the buyer audience reading the output.
Four clusters emerged from the assessment data, with the following profiles:
Operator. Highest in Growth Mindset (around 83), Bias for Action (around 83), and Ownership (around 70). Also strong in Trust-Building (around 79) and Resilience (around 70). Fast, adaptive, growth-minded, takes ownership. Strong fit for growth-stage product and go-to-market roles, leadership pipeline, and any function where speed and personal agency drive outcomes.
Stabilizer. Highest in Trust-Building (around 82) and Resilience (around 77). Lower in Ownership (around 57). Trust-building, dependable, calm under pressure. Strong fit for support, quality assurance, and internal operations roles where consistency, reliability, and team-orientation matter more than fast execution.
Learner. Balanced. High Growth Mindset (around 79), moderate Ownership (around 64). Lower in Trust-Building and Resilience. Motivated to grow, still developing the reliability and team-coordination dimensions. Strong fit for entry-level roles with structured mentorship, training-focused programs, and individual-contributor work where coaching is part of the role.
Collaborator. Lowest in Growth Mindset (around 69), Ownership (around 54), and Resilience (around 62). Moderately high in Trust-Building (around 78). Team-oriented but with lower personal drive or adaptability. Strong fit for well-defined roles with clear direction, where interpersonal harmony is a priority and the work is more structured than exploratory.
The four-cluster solution was internally consistent. Operators and Stabilizers loaded onto opposite sides of an action-orientation dimension, with Learners and Collaborators differentiating mainly on growth orientation. The validity argument for the instrument itself is more involved and lives in the company’s internal documentation.
The cross-mapping
The four archetypes in each study are not identical to the four in the other study. They cannot be, because the instruments measure different things. What maps across the two studies is the space of archetypes, the four corners of the population structure.
| Conceptual archetype | Organization A label | Organization B label |
|---|---|---|
| Goal-driven executor with structured-environment fit | Achiever | Operator |
| Independent strength, lower team-orientation | Confident Specialist | Stabilizer |
| Curious, flexible, growth-oriented | Explorer | Learner |
| Lower baseline, early-career or needs structured development | Developing Potential | Collaborator |
The mappings are rough. The Organization A Achiever scores high on Self-Discipline and Cooperativeness, two competencies that are partially mismatched against the Organization B Operator who scores high on Bias for Action and Growth Mindset. The conceptual through-line is goal-driven execution, but the surface traits are different. Same for the other rows. Different inputs, similar outputs.
What I take from this methodologically: if two completely different instruments, run on two different populations in two different industries, recover the same four-corner archetype space, the structure is more likely to live in the population than in the instrument. The strong version of that claim would require many more replications across many more populations to defend rigorously. The weak version is enough to take cluster-based talent profiling seriously rather than treating it as a feature in a vendor demo.
The honest version: this is one finding from two studies in adjacent industries, with samples drawn from professional populations of similar career stages. Both populations skew toward people who have already passed some sort of screening to be in the workforce in the first place. Generalizing this cluster structure to populations very different from these two, for example to early-career applicant pools at scale, would need its own evidence. I am reading the convergence as suggestive, not as a general law.
The most-used artifact in both decks
The most cited slide from both deliverables turned out to be the same artifact: the cluster-by-role distribution table. Not the structural equation model from Part 2 of this series. Not the archetype names. The table.
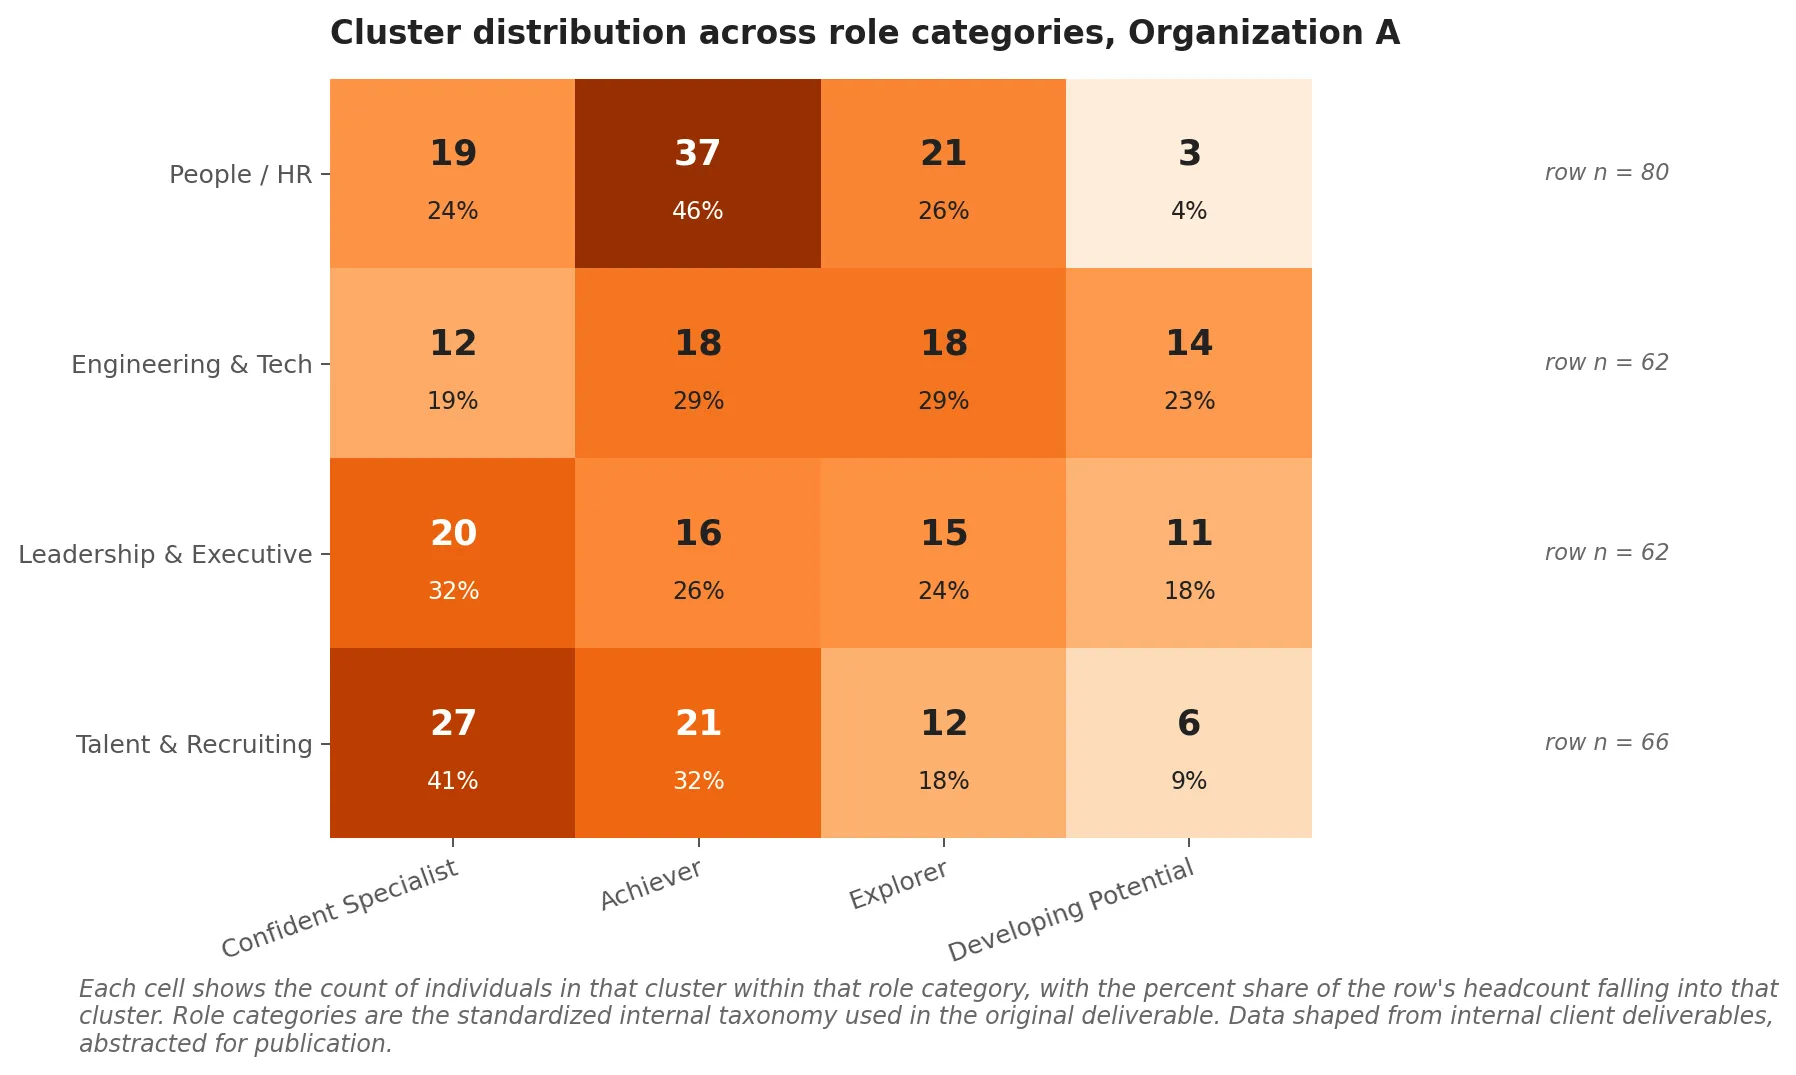
For Organization A, the table looks roughly like this:
| Role category | Confident Specialists | Achievers | Explorers | Developing Potentials | Row total |
|---|---|---|---|---|---|
| People / HR | 19 | 37 | 21 | 3 | 80 |
| Engineering & Tech | 12 | 18 | 18 | 14 | 62 |
| Leadership & Executive | 20 | 16 | 15 | 11 | 62 |
| Talent & Recruiting | 27 | 21 | 12 | 6 | 66 |
The actionable patterns sit in the row-by-row mix.
People and HR is dominated by Achievers (37 of 80, about 46 percent) and Explorers (21 of 80, about 26 percent), with very few Developing Potentials (3 of 80). This is a population that responds well to structured leadership pipeline programs and to innovation work where curious collaborators get cross-functional exposure.
Engineering and Tech has the highest concentration of Developing Potentials of any role category (14 of 62, about 23 percent). It also has a balanced mix across the other three clusters. This is the L&D priority signal in the data. The other functions can absorb light-touch development. Engineering and Tech needs structured mentorship and skill-building investment that the others do not.
Leadership and Executive is more evenly split, with a notable Confident Specialist concentration (20 of 62, about 32 percent). Confident Specialists in leadership roles are a fast-track candidate pool: independent, skilled, confident, ready for high-stakes assignments and influence work.
Talent and Recruiting is the most Confident Specialist-heavy of any role (27 of 66, about 41 percent), with relatively few Developing Potentials (6 of 66). The function is staffed with people who have a stable sense of their own capability, which is exactly what you want in roles that involve evaluating other people.
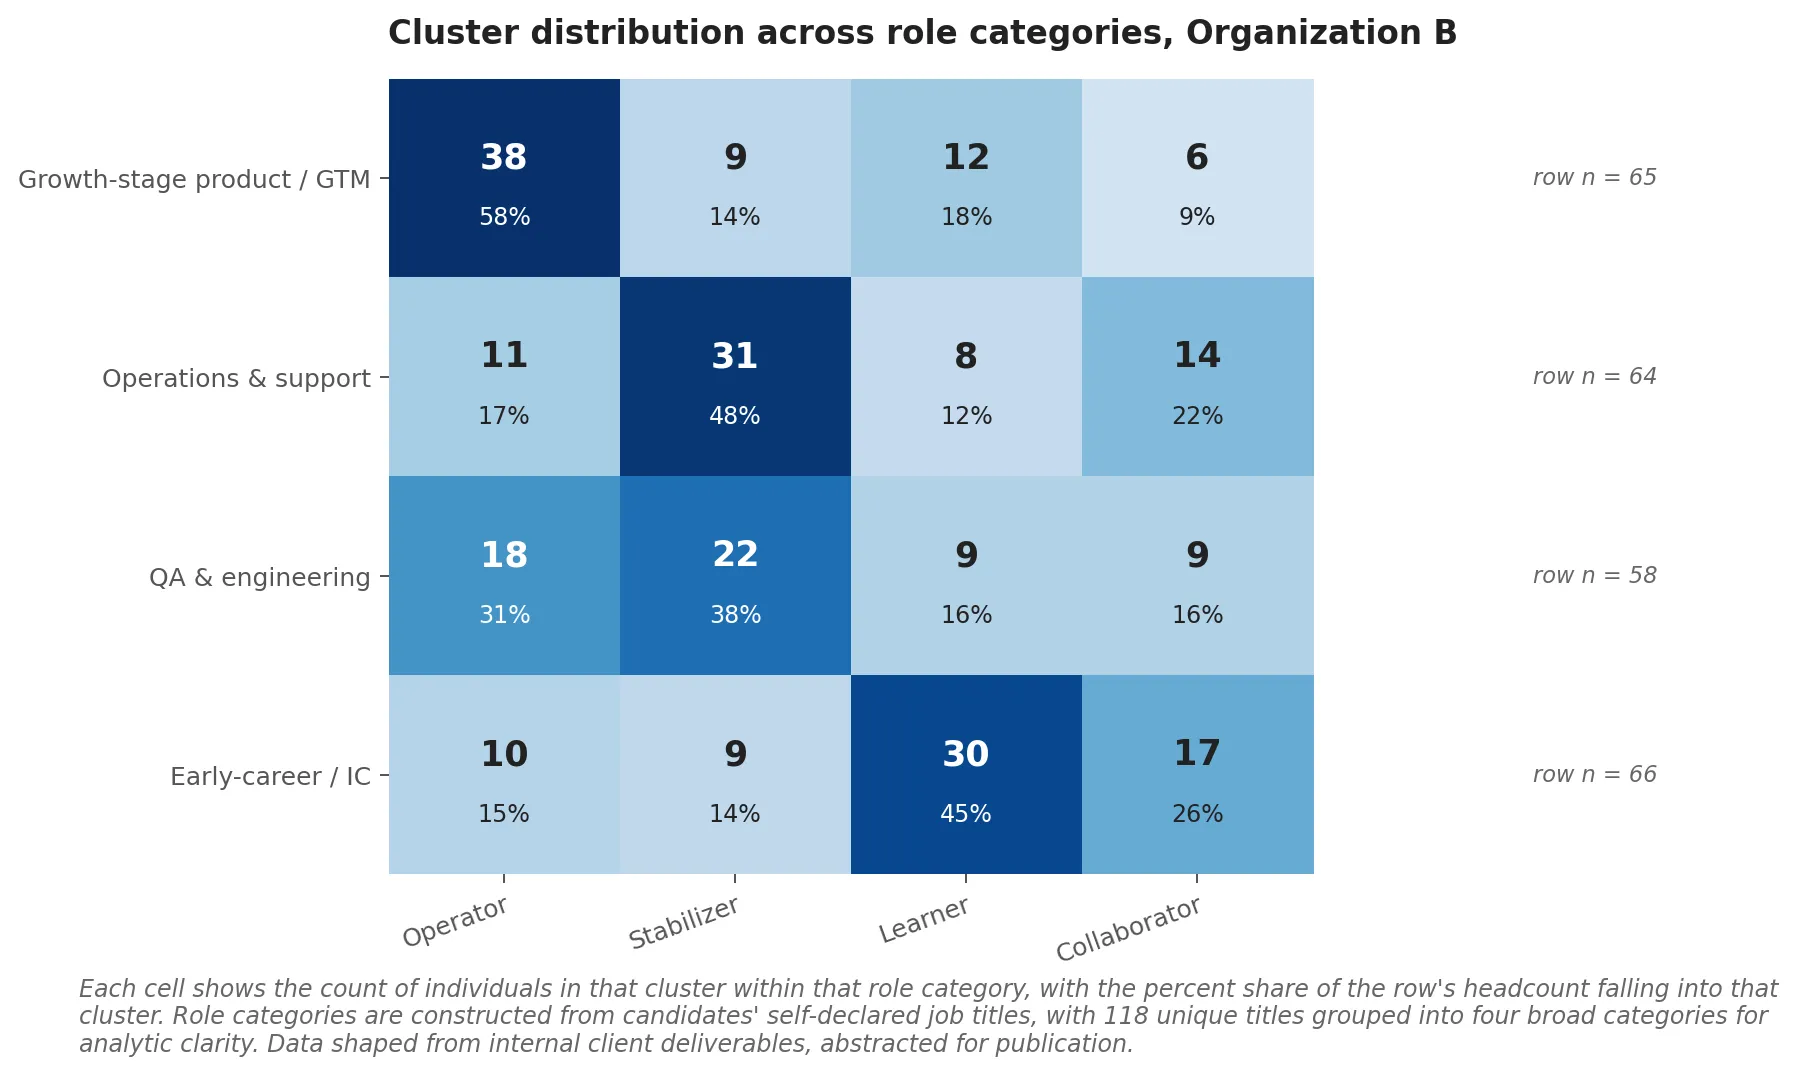
For Organization B, the equivalent table is similar in shape. Operators concentrate in growth-stage product and go-to-market roles. Stabilizers concentrate in operations, support, and quality assurance. Learners distribute toward early-career individual-contributor roles. Collaborators distribute toward team-oriented support roles. The row-by-row patterns differ in detail but the operational read is the same: each role category has its own cluster mix, and the mix is what tells you where the development budget should go.
The L&D budget allocation model the table enables
The mental model that comes out of the cluster-by-role table is the strongest operational deliverable from either engagement, and it speaks directly to how an organization should approach employee development planning at the program level.
The standard L&D budgeting model is by role: Engineering gets one training program, People and HR gets another, Leadership gets a third. The model assumes that the people within each role category need broadly similar development. The cluster-by-role table is the evidence that this assumption is wrong. Engineering and Tech in Organization A holds 62 people across four very different cluster profiles. A blanket engineering training program treats those 62 people as if they need the same thing. They do not.
The cluster-aware model is to budget by cluster within role. A Developing Potential in engineering needs structured mentorship and skill-building investment. An Explorer in engineering needs cross-functional exposure and stretch projects. A Confident Specialist in engineering needs strategic high-impact work and influence training. An Achiever in engineering needs delivery-leadership pathways. The cluster table tells you the mix you are working with, which means it tells you the proportions in which to allocate the budget.
The cluster mix is also a hiring signal. A role category with no Achievers or Operators in the data is a category that is not attracting (or not retaining) goal-driven executors. That information is about the recruiting funnel and the role design, not just about the people currently in the role. Same logic in the other direction: a role category dominated by Confident Specialists may be underweight on the collaborative profiles that make cross-functional work possible. The cluster mix becomes a diagnostic for the recruiting and role-design layers above it.
What this does not give you is individual-level prediction. Cluster membership is a descriptive label for people whose competency or values profile groups together. It does not tell you that a specific person will succeed or fail in a specific role. Used at population level it sharpens budget allocation. Used at individual level it should be one input among many, with the same humility you would apply to any other psychometric output.
Honest caveats and what comes next
The convergence finding I led with is the most interesting thing in either deck and also the most fragile claim. Two studies in two adjacent industries, both run within the same eighteen-month window, both designed by the same practitioner. There are alternative explanations for the convergence that I cannot rule out from the data: a methodological signature in the four-cluster choice itself, similar self-selection effects in who enters Big Tech-adjacent professional populations, similar age and tenure distributions in the two samples. Replication across more diverse populations and more diverse instruments is what would turn the convergence into a defensible general claim. Reading it as suggestive is the appropriate stance.
The cluster labels are heuristic. “Developing Potential” is meant to read as “lower-baseline, early-career, high investment value”, not as a verdict on anyone’s prospects. “Collaborator” is meant to read as “team-oriented but with lower personal drive in this measurement”, not as a permanent description of a person’s professional identity. Cluster boundaries also blur at the edges. Someone scoring near the boundary between Achiever and Explorer should be treated as both, not assigned to one and forgotten.
The cluster-by-role tables are the most actionable artifact in the engagements. They are also the one I would defend most strongly as a generalizable design pattern. The L&D mental model that comes out of the tables is recoverable across other organizations that run similar cluster analyses on their own people. The archetype labels and exact score profiles will differ. The mental model should not.
Part 2 of this series covers the structural equation model results from both studies, which produced their own convergence finding: years of professional experience predicts exactly two psychometric traits in each study, and not the others. That has direct implications for how high-potential programs should be designed. Part 3 covers the build-versus-buy decision for psychometric instruments, which is the methodological question that sits underneath both engagements.
If you are running a custom psychometric engagement at your own organization and want to talk about how cluster-based profiling fits into your talent strategy, I am reachable through the contact form. The methodology context for all of this lives in the earlier post on what custom psychometric work actually is, and more on the platform side of this work lives at Gyfted.