How to Measure Employee Engagement When Gallup's Numbers Don't Fit Your Org
Gallup’s State of the Global Workplace, 2026 edition, lands on a number that should be uncomfortable reading for a lot of HR functions. 22 percent of managers are engaged at work globally, down 9 points since 2022. In best-practice organizations that figure is 79 percent. Same instrument, same methodology, 57 percentage points apart.
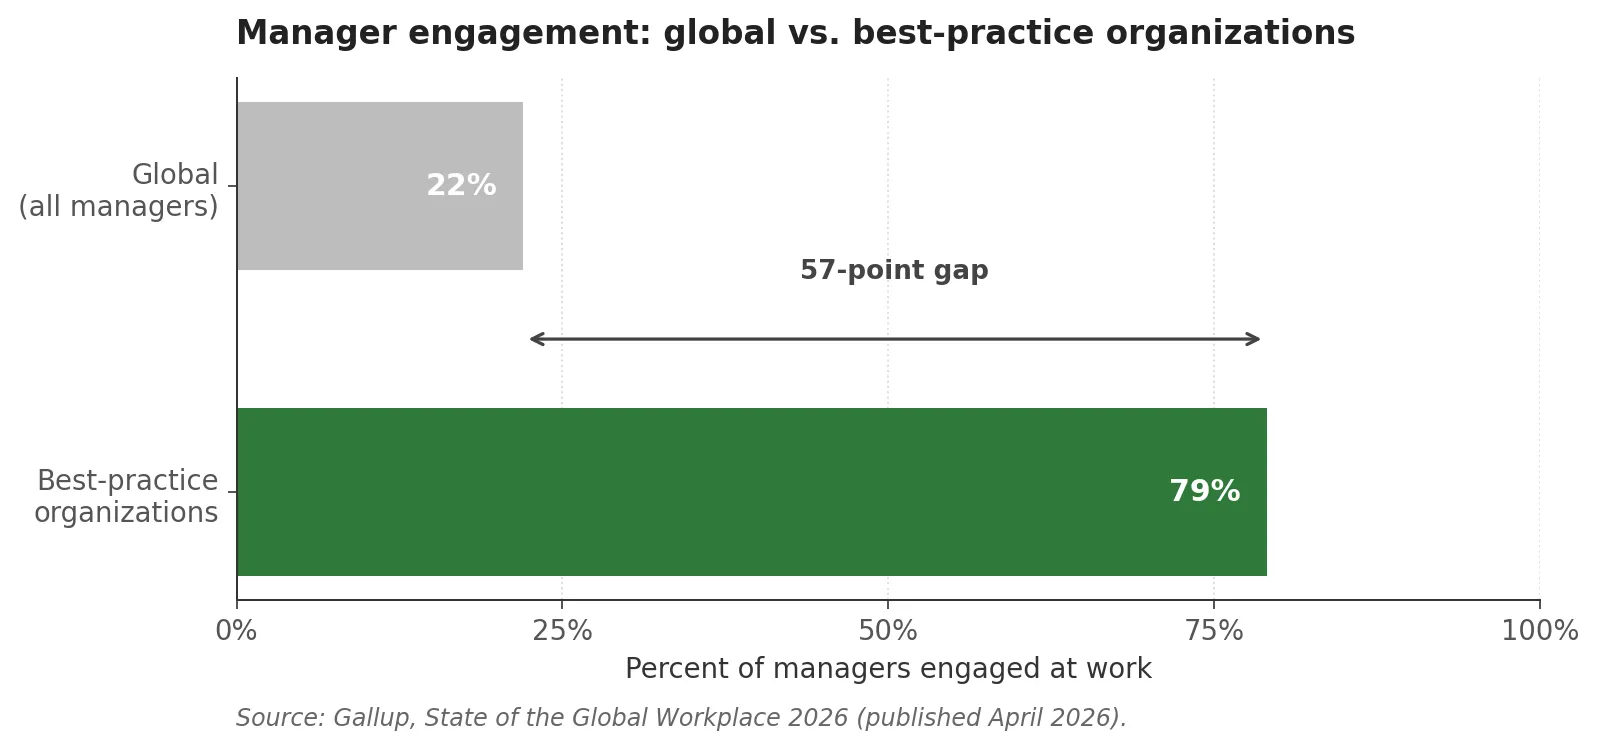
That gap is the report’s strongest signal. It tells you that manager engagement is fixable. It says almost nothing about why some organizations run in the 79-percent range and others don’t. The question falls outside what a population-level diagnostic can answer, and answering it in your own organization requires a different kind of measurement.
What Gallup’s 2026 State of the Global Workplace really says about managers
The other headline numbers set up the rest of the argument. Global employee engagement fell to 20 percent in 2025, the lowest level since 2020. The split is 20 percent engaged, 64 percent not engaged, 16 percent actively disengaged. Manager engagement specifically dropped 9 points since 2022, landing at 22. Female managers lost 7 points, managers under 35 lost 5. Gallup estimates the cost of disengagement at about $9 trillion, roughly 9 percent of global GDP.
Then the benchmark. Within what Gallup calls best-practice organizations, which is shorthand for clients who’ve built systematic engagement programs around the Q12 methodology, manager engagement runs at 79 percent. Thriving figures are higher. Burnout figures are lower. The business outcomes Gallup tracks, productivity and retention and safety and profitability, cluster on the upside.
Two things are true here. First, Gallup’s aggregate numbers are genuinely useful. They tell you the climate you’re hiring, managing, and building culture into. The 2026 report is good context for strategy, board conversations, and benchmark-setting. It belongs in an HR leader’s information diet.
Second, aggregate numbers are blind to organizational specifics. You cannot decide whether your managers are the problem from a global average. You cannot tell whether your engagement drop reflects the labor market or something local. You cannot use a benchmark figure to decide which of your specific teams or managers need intervention. That is not what the instrument is designed to do.
Why off-the-shelf tools for measuring employee engagement fail at the org level
There’s a familiar pitch from HR-tech vendors. Buy our platform, run our engagement survey, watch your scores improve. The platforms are real, the surveys are mostly well-constructed, and the scores do move. The problem sits one level down, in what the scores actually represent.
Most commercial engagement instruments, including the Q12, combine items that measure different things. Some items capture engagement-as-outcome, meaning how enthusiastic, committed, or energetic someone feels about their work. Some capture engagement-as-antecedent, meaning whether you have the materials you need, whether someone at work cares about you, whether you have a friend at work. When you build a composite score across both, you get a number that’s predictive of business outcomes, because of course it is. You mixed the cause and the effect into the same variable.
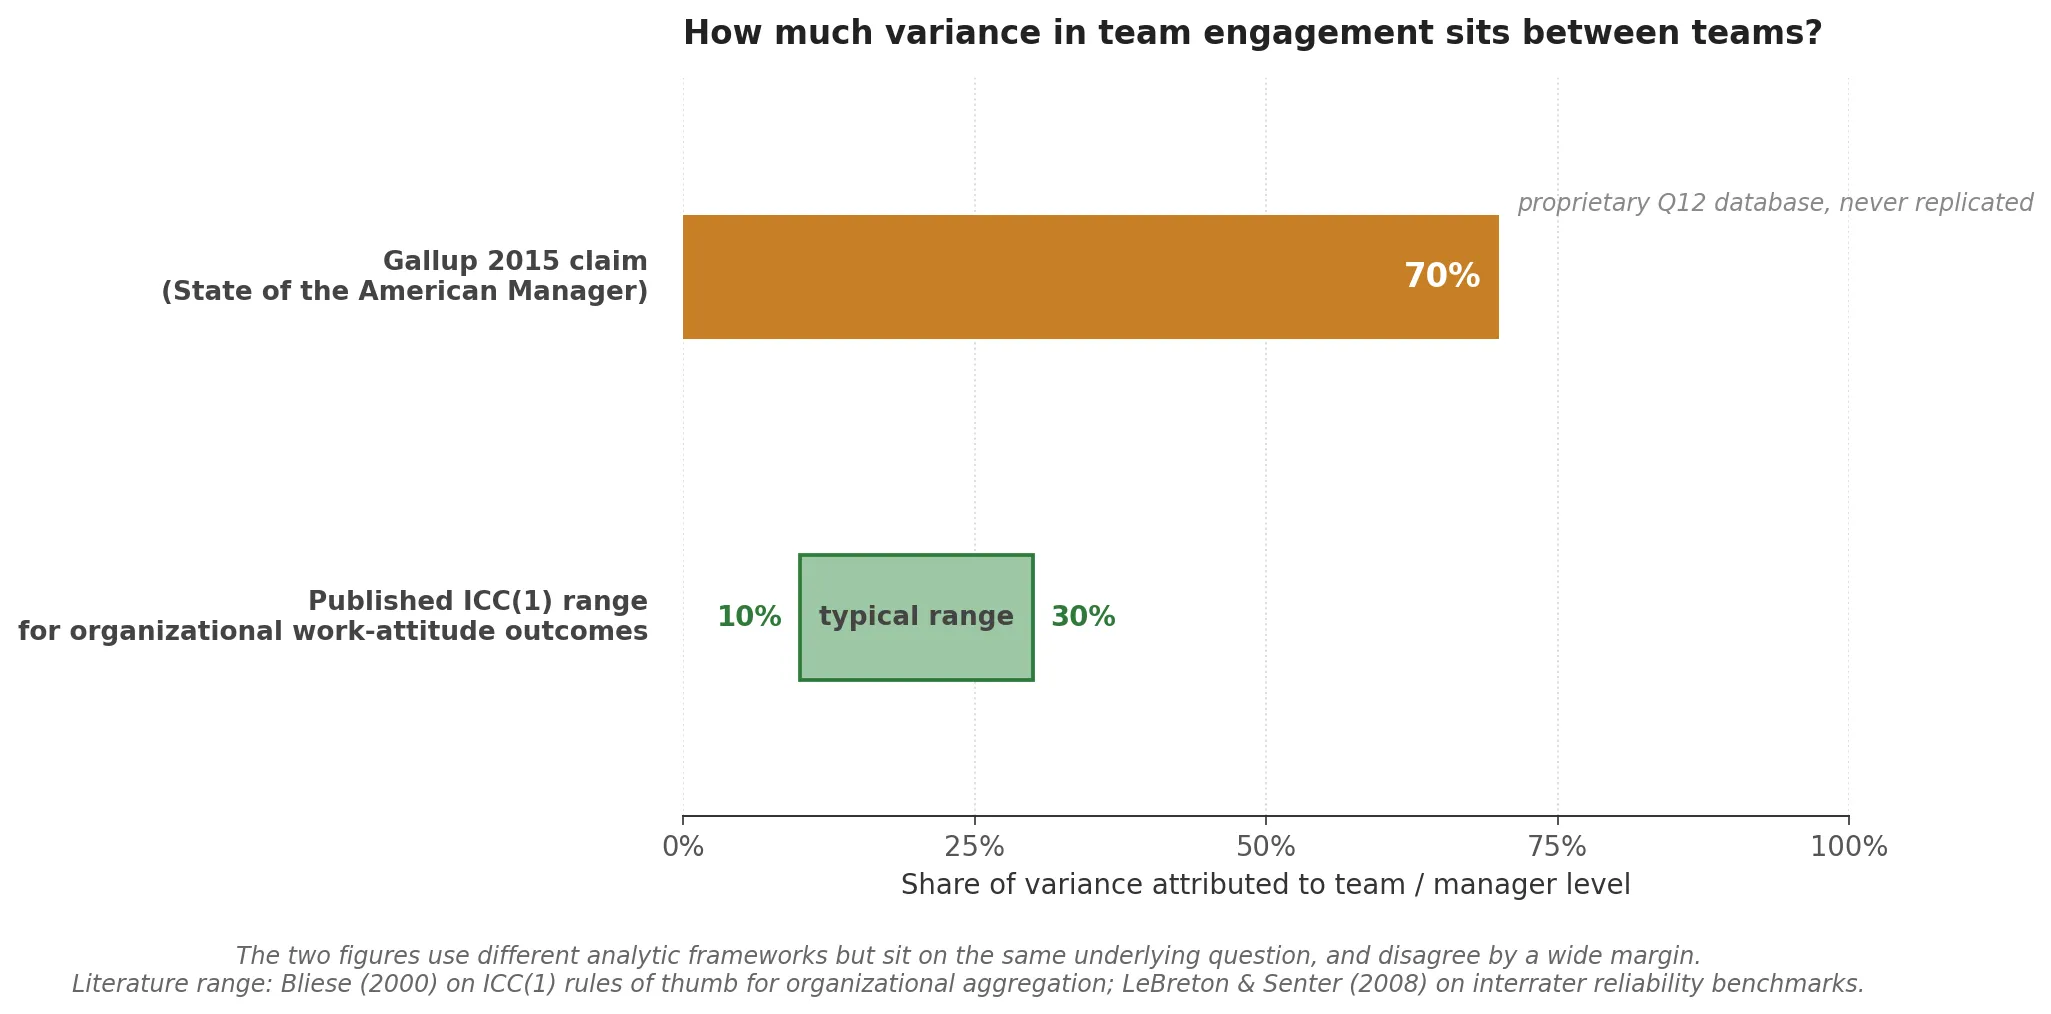
This matters for interpretation. If the Q12 includes items that are themselves manager behaviors, and you then use the Q12 to find that managers drive engagement, you have a partially tautological result. The classic Gallup finding that managers account for roughly 70 percent of the variance in team engagement, originally published in the 2015 State of the American Manager report, is often cited as if it were a peer-reviewed causal result. It’s a Gallup-internal estimate from a proprietary Q12 database, never independently replicated, and the underlying instrument has construct-validity issues that I/O psychologists have been debating since Macey and Schneider in 2008.
None of that means Gallup is wrong. The directional claim, that managers matter enormously, is robust across many research traditions. It means that if you’re serious about measuring engagement in your own organization, you need instruments designed for your specific question, not instruments optimized for cross-industry benchmarks. Population validity and local validity are different problems.
What measuring employee engagement actually requires: a psychometric perspective
There’s a working definition of psychometric assessment worth stating plainly. Custom psychometric work has four components.
Construct definition. What are you actually trying to measure, in the operating language of this organization? Not “engagement” as a generic latent variable, but the specific behaviors, values, competencies, or team dynamics that matter for the decisions you’re about to make. If you’re selecting leaders, you’re measuring leadership potential as your organization defines it. If you’re diagnosing team function, you’re measuring alignment against your own operating model. Construct definition is half the work and the part most programs skip.
Instrument design. Item writing, response formats, length, reading level. Whether to use Likert scales, forced-choice, ranking, situational judgment items, or combinations. Whether to include adaptivity. Whether to include social-desirability controls. This is where psychometric craft lives, and it doesn’t transfer freely across domains. An instrument that works in volume hiring won’t necessarily work in leadership development.
Validation. Item analysis under classical test theory to confirm each item behaves the way you designed it. Confirmatory factor analysis to test whether the structure you intended is the structure respondents actually produce. Item response theory where the use case and sample permit. Accumulating construct-validity evidence across external criteria. This is what separates custom psychometric work from custom survey design.
Feedback architecture. Scores without decision logic are waste. Custom work includes the design of what the organization actually does with the output: thresholds, role mappings, benchmark comparisons, report layouts built to the decisions they support. A beautifully validated instrument that produces a number nobody can act on has failed at the last mile.
Those four components are what the word “psychometric” is doing when you put it next to “measurement.”
How the work gets done at Gyfted
Most of my commercial psychometric work runs through Gyfted, the AI-powered assessment platform I co-founded with Robert Kowalski and Adam Szefer. I’m co-founder and Chief Product Officer there, and I own product architecture and psychometric design: instrument construction, scoring logic, validation pipelines, feedback systems. When I describe custom work for an enterprise client below, I’m describing instruments I personally designed and validated. The engineering, the ML matching algorithms, the infrastructure, all of that is team work and I’ll use “we” for it. The psychometric architecture is mine, and I’ll use “I” for it.
This matters for what follows. Commercial assessment companies routinely publish case studies as if the work were uniformly a team achievement. For most platform deployments that framing is accurate. For custom instrument design it is not, and collapsing the two flattens the thing that actually distinguishes one engagement from another.
Three client engagements, three different measurement problems
LSEG: hiring at scale in a domain-specific role
At Gyfted, I designed the assessment architecture for London Stock Exchange Group’s Gdynia shared service centre, a 1,300-plus-FTE operation. The engagement covered five energy and analytics roles: Data Analyst, Senior Gas Market Analyst, Coal Market Research, LNG Analyst, Power Market Research Analyst. Over the program we screened 250-plus candidates, invited 47 for final interviews, and placed five hires. Recruiter review time dropped by about 60 percent on the covered roles.
What made the work custom was the role-specific calibration. LSEG’s energy-market analyst profile is not a generic analytical-cognition profile. It requires a particular combination of quantitative reasoning, domain-relevant pattern recognition, and comfort with incomplete information under time pressure. The instrument was tuned to that combination rather than to a generic screening template. The LSEG case study on Gyfted’s site has the full engagement details.
EPAM: one measurement layer, four program-specific decisions
For EPAM’s internal talent development, my part of the work was mapping their existing internal competency matrix onto validated psychometric constructs, so one layered assessment architecture could serve four distinct programs with different decision criteria: High Performance (HiPo), Senior Leadership, High Performance for Women, and Juniors. Four hundred-plus individuals were assessed across the pilots. The tools are now used by EPAM’s Leadership Development, Talent Development, and Talent Acquisition functions across EMEA and APAC.
What made the work custom wasn’t one specially-built instrument. It was the architecture decision: don’t build four separate assessments, build an underlying measurement layer that feeds four distinct program-specific decision layers. The competency matrix became the translation between EPAM’s internal language and standard psychometric constructs. The EPAM case study on Gyfted’s site covers the program structure.
gr8.tech: discriminative measurement of values
For gr8.tech I designed a custom values and fit assessment tied to the company’s operating philosophy. The design problem there was discriminative validity. Off-the-shelf values inventories tend to produce ceiling effects. Most candidates rate most prosocial values as important, which means the instrument tells you almost nothing about differences between people.
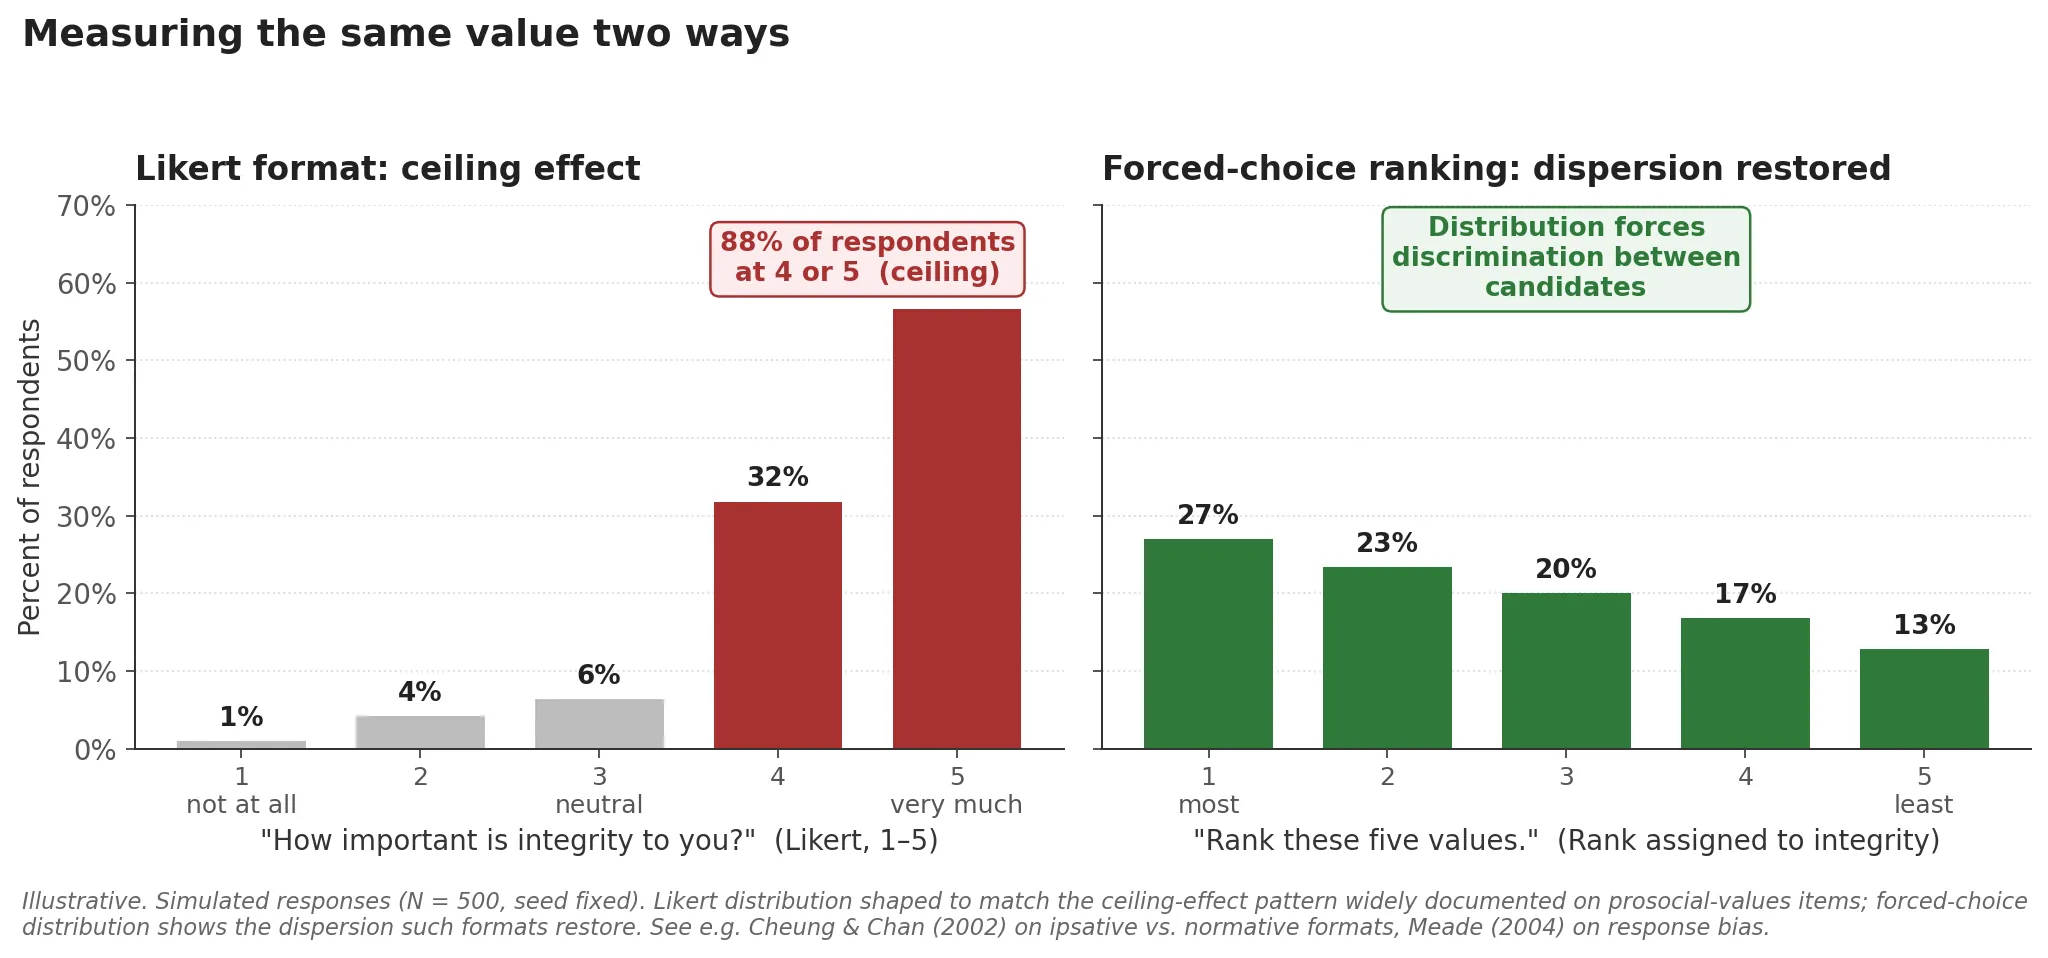
The fix was format combination. The instrument used forced-choice for the core values items, ranking for relative prioritization, and situational judgment items to ground abstract values in concrete workplace scenarios. Forced-choice makes candidates trade off items they’d otherwise all endorse. Ranking reveals relative weight. Situational judgment separates candidates who can articulate values from candidates whose described behavior tracks them. The feedback layer translated all of it back into gr8.tech’s own operating language, so hiring managers were reading alignment to gr8.tech’s stated values rather than raw Big Five trait scores.
I’ve also built custom instruments for public-sector and higher-education clients, with different design constraints and different decision logic. That’s a subject for a separate post.
When to commission custom engagement measurement, and when not to
Custom psychometric work isn’t always the right call. Here’s the honest version of when it is and when it isn’t.
It’s the right call when:
- You’ve already run engagement surveys and the results haven’t answered the question you’re actually stuck on. More survey waves won’t help.
- Your operating model, values, or competency definitions aren’t generic. Generic instruments don’t measure alignment to specific things.
- The decisions you need to support are consequential enough to justify the investment. Senior hiring, leadership selection, high-stakes promotion, restructure planning.
- You have enough sample size per role, program, or population to support proper validation. Custom work needs data to validate against.
It isn’t the right call when:
- You haven’t yet defined the construct you want to measure. Start there. Custom instrument design begins with construct definition, and if that’s still unclear, spend the early budget on that phase before building anything.
- You need a score next week. Custom work is a multi-week to multi-month engagement. If the timeline is urgent and the decision is low-stakes, an off-the-shelf instrument you partially trust is usually better than a custom one you can’t finish.
- The population is too small or too heterogeneous for validation. Psychometric validation needs enough respondents to produce stable item statistics. Custom work without validation is just custom survey design with better branding.
- The decision doesn’t actually need decision-grade measurement. If you’re running a pulse check for internal communications, Gallup’s Q12 or any credible off-the-shelf instrument is probably fine.
If any of this resembles a call you’re making, I’m reachable through the contact form. I’ll tell you honestly whether custom work is the right fit, and if it isn’t, I’ll tell you what is.
Further reading
If you want to see what the validation discipline looks like applied end-to-end on a non-commercial project, the item-level analysis I ran on university exam data is the cleanest public receipt I can offer. That piece walks through CTT item statistics, distractor analysis, and reliability estimation on real test data. The same machinery, applied to organizational measurement, is what makes custom work psychometric rather than just custom.